Irish Local Authority Housing Delivery 2011-2026: A Comparative Performance Analysis
Blue Dot Consulting
Introduction
Between 2011 and 2026, Ireland’s local authorities built, acquired, leased, and contracted social housing units that number, at a national level, in the tens of thousands per year by the mid-2020s. This was in contrast to the near-total collapse in direct construction output that defined the austerity years of 2011 to 2014. The headline delivery figures sit alongside targets set formally from 2018 onward under successive government action plans. The gap between those two numbers tells one story. The other story is what Local Authorities delivered what, and through what mechanisms.
This research article from Blue Dot Consulting examines Irish public housing delivery. It draws exclusively on published data: DHLGH Housing Delivery Action Plan datasets and annual social housing activity files (published at gov.ie); Housing Agency completion statistics; Central Statistics Office (CSO) census and construction surveys; and Local Authority housing action plan returns. No unpublished or commercially sensitive data is used or inferred.
The aim is to put what the public record actually shows in front of professionals, policymakers, and commissioners who need a clear-eyed picture of where delivery has happened, where the challenges are, and what the data can and cannot tell us.
A note on data period: the DHLGH published its most comprehensive comparative dataset in July 2025, covering new-build social housing delivery against Housing for All targets for the period 2022 to 2024 across all 31 local authorities. A 2025 single-year dataset was also published, allowing a more detailed assessment of recent trajectory. This article uses both to present a picture of national and regional delivery.
1. The Austerity Baseline: 2011-2017
To understand Irish social housing delivery in the period since 2018, the preceding seven years of near-total contraction need to be established as a baseline.
The years from 2011 to 2017 were defined, from a social housing construction perspective, by the withdrawal of direct Local Authority build as a delivery mechanism. Capital expenditure on local authority housing construction fell sharply in the wake of the post-2008 fiscal adjustment, and the State’s primary housing response shifted to Housing Assistance Payment (HAP) and Rental Accommodation Scheme (RAS) - demand-side instruments that supported households in the private rental market rather than adding units to the social housing stock.
This had consequences for local authority housing delivery. National combined Local Authority and AHB new-build social housing output, which had run at approximately 7,000 units per year in the 2005 to 2007 period, reduced to fewer than 760 units in 2013 and 2014 combined - a decline of over 90%. In 2013 - the trough year - national output stood at approximately 546 units across all 31 local authorities. In 2014 it fell further to approximately 285 units. Government capital expenditure on social housing fell from over €1.5 billion in 2008 to under €300 million in 2013, an 80% CAPEX reduction over five years.
Many local authorities built no new social housing at all in those trough years. The collapse was the result of a national policy decision to withdraw capital from direct construction and substitute demand-side subsidies. That context is important as reading the delivery data that follows.
The Approved Housing Body (AHB) sector partially offset the contraction in direct LA build, but AHB delivery was itself constrained by reduced capital lending from the Housing Finance Agency and the general tightening of development finance. The net effect was a sustained drawdown of the social housing construction pipeline that would take most of the following decade to rebuild.
Two structural consequences of this period are relevant to any delivery analysis of the subsequent target era. First, the pipeline of shovel-ready social housing projects in 2017 to 2018 was thin: years of reduced capital spend had depleted design, planning consent, and procurement activity to the point where even when funding was restored, output could not respond immediately. Second, the workforce and contractor capacity to deliver public housing at scale had contracted alongside the pipeline. Both constraints were present when the Government set its revised targets from 2018 onward.
2. The Target Era: 2018-2026 - National Delivery Against Housing for All Targets
The Rebuilding Ireland Action Plan (2016) and its successor, Housing for All (2021), introduced explicit numerical targets for social housing delivery. For the purposes of this analysis, we treat the period from 2018 as the “target era” - the point from which meaningful delivery-against-target comparisons can be made at local authority level.
Under Housing for All, individual local authorities were assigned multi-annual new-build targets through the DHLGH Housing Delivery Action Plan framework, with annual datasets published on gov.ie. The DHLGH published its most comprehensive comparative LA-level dataset in July 2025, covering the period 2022 to 2024.
What the target framework measures
The Housing for All per-LA targets are set for new-build social housing delivery. They exclude leasing arrangements, acquisitions of second-hand properties, and HAP. The “85.2% of target” figure and any authority-specific percentage in this section refer to this new-build definition, not to total social housing output (which is a broader, higher figure). This is the difference between measuring whether Ireland is building new supply and whether it is moving households off waiting lists through any available mechanism.
National delivery against target (2022-2024)
Nationally, cumulative social new-build delivery across the three-year 2022 to 2024 period reached 23,355 units against a cumulative new-build target of 27,400 units, representing 85.2% of target. This headline figure includes LA direct build, LA and AHB turnkey, AHB build, and Part V contributions. The headline masks considerable variation by year, by delivery mechanism, and - most significantly for this analysis - by local authority.
Council direct build: a system-wide constraint
The council own-build figure - homes a local authority directly constructs itself - is the most revealing metric of state delivery capacity. Across the four years 2022 to 2025, local authorities directly built just 6,689 units against a cumulative own-build target of 37,400 - 17.9% of target. (This own-build measure is a subset of total new-build and spans the full 2022-2025 target window; the ranked table immediately below covers total new-build delivery across all mechanisms - LA and AHB build, turnkey, and Part V - for the 2022-2024 period.) This is a system-wide pattern, not an authority-specific one. It reflects the depletion of direct construction capacity described in Section 1, which has not been rebuilt at the pace the target framework assumed. Every LA is affected; the degree varies.
All 31 local authorities ranked: 2022-2024 new-build delivery
The table below ranks all 31 local authorities by social housing new-build completions as a percentage of their assigned 2022 to 2024 target, drawn from the DHLGH “Overall new-build social housing delivery versus target by Local Authority 2022-2024” file (July 2025). The full dataset is available for download at the foot of this article.
| Rank | Local Authority | Target 2022-2024 | Delivered 2022-2024 | % of Target |
|---|---|---|---|---|
| 1 | Laois | 359 | 670 | 186.6% |
| 2 | Meath | 832 | 1,405 | 168.9% |
| 3 | Wicklow | 847 | 1,206 | 142.4% |
| 4 | Monaghan | 238 | 316 | 132.8% |
| 5 | Offaly | 315 | 397 | 126.0% |
| 6 | Kildare | 1,179 | 1,324 | 112.3% |
| 7 | Clare | 502 | 563 | 112.2% |
| 8 | Cork City | 1,601 | 1,689 | 105.5% |
| 9 | Louth | 976 | 1,030 | 105.5% |
| 10 | Kilkenny | 472 | 493 | 104.4% |
| 11 | Wexford | 768 | 799 | 104.0% |
| 12 | Dun Laoghaire-Rathdown | 1,186 | 1,208 | 101.9% |
| 13 | Carlow | 262 | 266 | 101.5% |
| 14 | South Dublin | 1,821 | 1,825 | 100.2% |
| 15 | Tipperary | 543 | 537 | 98.9% |
| 16 | Leitrim | 82 | 80 | 97.6% |
| 17 | Roscommon | 135 | 111 | 82.2% |
| 18 | Waterford | 593 | 487 | 82.1% |
| 19 | Westmeath | 470 | 386 | 82.1% |
| 20 | Mayo | 395 | 304 | 77.0% |
| 21 | Cork County | 1,818 | 1,304 | 71.7% |
| 22 | Kerry | 843 | 589 | 69.9% |
| 23 | Cavan | 312 | 212 | 67.9% |
| 24 | Limerick | 1,580 | 1,056 | 66.8% |
| 25 | Fingal | 1,755 | 1,152 | 65.6% |
| 26 | Longford | 225 | 143 | 63.6% |
| 27 | Galway County | 939 | 595 | 63.4% |
| 28 | Galway City | 748 | 467 | 62.4% |
| 29 | Sligo | 270 | 149 | 55.2% |
| 30 | Dublin City | 4,800 | 2,344 | 48.8% |
| 31 | Donegal | 534 | 248 | 46.4% |
| National | - | 27,400 | 23,355 | 85.2% |
Source: DHLGH “Overall new-build social housing delivery versus target by Local Authority 2022-2024” Excel file, July 2025 (gov.ie). Ranks assigned by percentage of target delivered.
The range across the 31 authorities is wide: from 186.6% (Laois) to 46.4% (Donegal). Fourteen authorities exceeded their three-year target. Thirteen delivered between 63% and 99% of target. Four delivered below 63% - Galway City, Sligo, Dublin City, and Donegal.
The pattern is not a simple urban-rural divide. Several commuter-belt and rural authorities significantly exceeded targets (Laois, Meath, Wicklow, Monaghan, Offaly). Several large urban authorities significantly underperformed (Dublin City at 48.8%, Fingal at 65.6%). The factors driving performance variation - pipeline maturity, AHB capacity, land availability, infrastructure constraints - differ by authority and are examined further in Section 4.
3. The 2025 Picture: Where the National Story Improved and Where It Did Not
The 2025 single-year new-build data, published by DHLGH, shows a national picture that improved substantially over the 2022 to 2024 average, but with significant divergence across individual authorities.
Nationally, 2025 was the strongest year on record under Housing for All, with 9,088 new-build social homes delivered against a target of 10,000 - 90.9% of target, up from 85.2% across the three-year 2022 to 2024 period. Seventeen authorities delivered at or above 100% of their 2025 target.
However, a significant group of authorities moved in the opposite direction. The full 31-authority 2025 ranked table is the centrepiece of this dataset release.
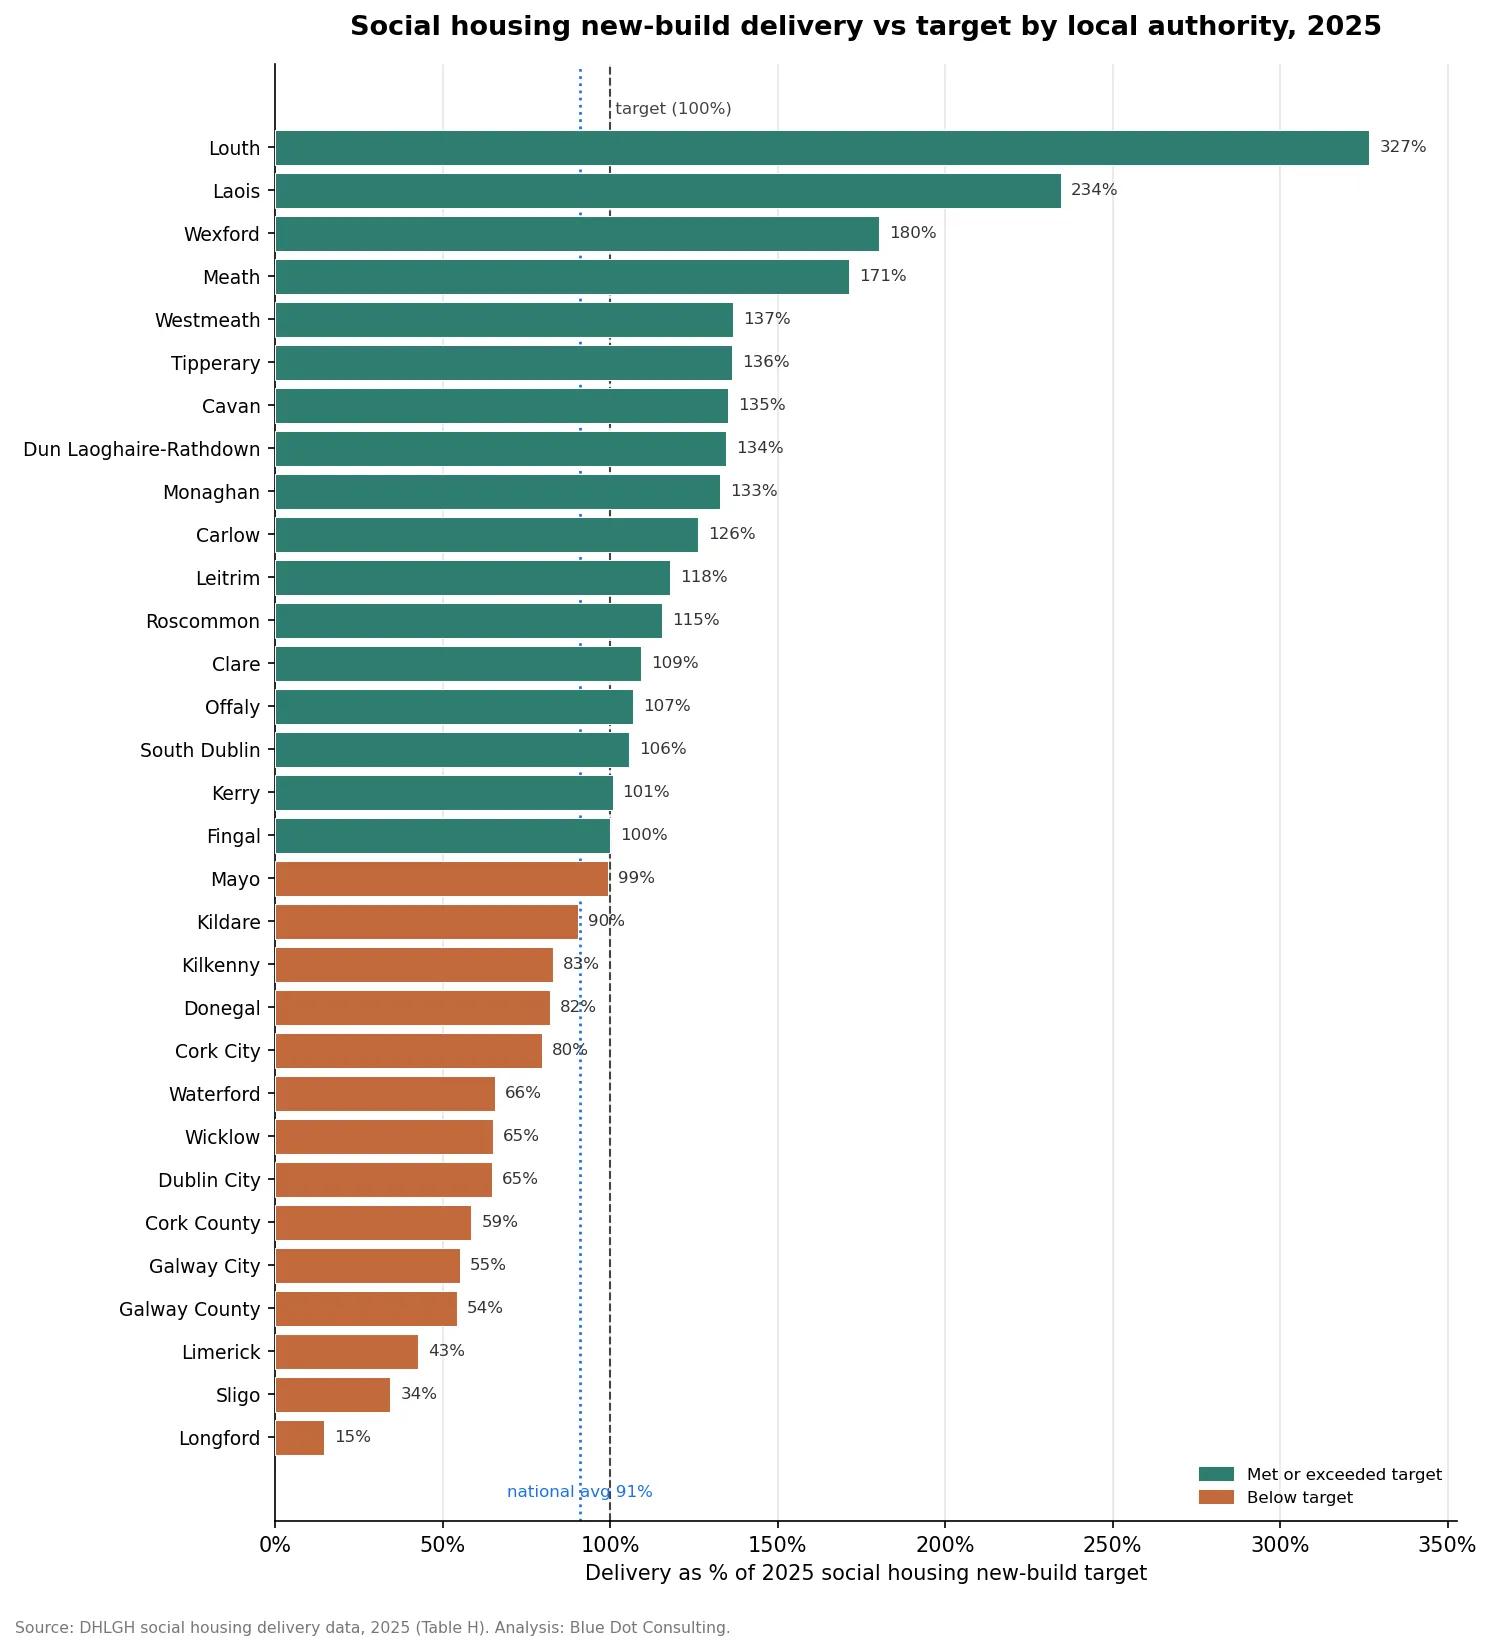
All 31 local authorities ranked: 2025 new-build delivery
| Rank | Local Authority | Target 2025 | Delivered 2025 | % of Target |
|---|---|---|---|---|
| 1 | Louth | 172 | 562 | 326.7% |
| 2 | Laois | 87 | 204 | 234.5% |
| 3 | Wexford | 189 | 341 | 180.4% |
| 4 | Meath | 267 | 457 | 171.2% |
| 5 | Westmeath | 136 | 186 | 136.8% |
| 6 | Tipperary | 170 | 232 | 136.5% |
| 7 | Cavan | 88 | 119 | 135.2% |
| 8 | Dun Laoghaire-Rathdown | 400 | 538 | 134.5% |
| 9 | Monaghan | 61 | 81 | 132.8% |
| 10 | Carlow | 99 | 125 | 126.3% |
| 11 | Leitrim | 28 | 33 | 117.9% |
| 12 | Roscommon | 52 | 60 | 115.4% |
| 13 | Clare | 164 | 179 | 109.1% |
| 14 | Offaly | 73 | 78 | 106.8% |
| 15 | South Dublin | 772 | 816 | 105.7% |
| 16 | Kerry | 287 | 289 | 100.7% |
| 17 | Fingal | 758 | 759 | 100.1% |
| 18 | Mayo | 166 | 165 | 99.4% |
| 19 | Kildare | 440 | 398 | 90.5% |
| 20 | Kilkenny | 164 | 136 | 82.9% |
| 21 | Donegal | 171 | 140 | 81.9% |
| 22 | Cork City | 592 | 472 | 79.7% |
| 23 | Waterford | 230 | 151 | 65.7% |
| 24 | Wicklow | 248 | 161 | 64.9% |
| 25 | Dublin City | 2,122 | 1,375 | 64.8% |
| 26 | Cork County | 683 | 400 | 58.6% |
| 27 | Galway City | 241 | 133 | 55.2% |
| 28 | Galway County | 385 | 209 | 54.3% |
| 29 | Limerick | 551 | 235 | 42.6% |
| 30 | Sligo | 122 | 42 | 34.4% |
| 31 | Longford | 82 | 12 | 14.6% |
| National | - | 10,000 | 9,088 | 90.9% |
Source: DHLGH “Local Authority New-build Delivery VS Overall Social Housing New-build Targets 2025” Excel file, parsed from official DHLGH publication. Download the underlying dataset: la_housing_delivery_2025.csv.
Reading the 2025 distribution
The divergence across authorities in 2025 is more pronounced than in the 2022 to 2024 cumulative period. Louth delivered 327% of its target - 562 units against a target of 172 - driven by strong AHB turnkey delivery. At the other end, Longford delivered 12 of 82 (14.6%) and Sligo 42 of 122 (34.4%). Three authorities - Longford, Sligo, and Limerick - delivered below 43% of their target in a year when the national average reached 90.9%.
Several authorities showed marked improvement from their 2022 to 2024 position. Louth ranked 9th in the 2022 to 2024 table and jumped to 1st in 2025. Dun Laoghaire-Rathdown moved from 12th to 8th. Conversely, some authorities that performed well in 2022 to 2024 fell back in 2025: Offaly dropped from 5th to 14th; Wicklow from 3rd to 24th; Monaghan from 4th to 9th. Year-on-year volatility is a feature of the data, and single-year readings should be interpreted alongside the multi-year trend.
Dublin City remains, on an absolute basis, the largest delivery challenge in the country: 1,375 units delivered against a target of 2,122 in 2025, adding to an already substantial 2022 to 2024 shortfall of 2,456 units.
Comparing the two periods
Cross-referencing the 2022 to 2024 and 2025 rankings identifies authorities whose underperformance appears persistent and those showing either recent recovery or recent deterioration. Authorities consistently in the lower half of both tables include Dublin City, Cork County, Galway City, and Galway County alongside Longford, Sligo, and Limerick. Authorities consistently in the upper half include Laois, Meath, South Dublin, Clare, and Kildare. The persistence of both high and low performers across periods suggests structural rather than incidental causes in both directions.
4. Comparing Like with Like: Population-Normalised Delivery Across Urban Authorities
A straight ranking of 31 authorities by percentage of target treats all targets as equally well-calibrated. A complementary lens is delivery expressed per unit of existing housing stock - a measure that controls partially for scale and captures the rate at which new supply is being added relative to what already exists.
The figures below express social housing new-build completions per 1,000 total housing units for the larger urban and city-and-county authorities, using CSO Census 2022 housing stock counts as the denominator.
Social housing new-build completions per 1,000 housing units, 2022-2024
| Local Authority | Housing Stock (Census 2022) | Social New-Build (2022-2024) | Per 1,000 Units | % of Target |
|---|---|---|---|---|
| Cork City | 91,107 | 1,689 | 18.5 | 105.5% |
| South Dublin | 100,136 | 1,825 | 18.2 | 100.2% |
| Dun Laoghaire-Rathdown | 96,305 | 1,208 | 12.5 | 101.9% |
| Galway City | 35,436 | 467 | 13.2 | 62.4% |
| Limerick | 85,363 | 1,056 | 12.4 | 66.8% |
| Meath | 75,870 | 1,405 | 18.5 | 168.9% |
| Waterford | 54,847 | 487 | 8.9 | 82.1% |
| Dublin City | 278,590 | 2,344 | 8.4 | 48.8% |
| Galway County | 82,337 | 595 | 7.2 | 63.4% |
| Fingal | 109,783 | 1,152 | 10.5 | 65.6% |
Sources: DHLGH new-build vs target 2022-2024 XLSX (July 2025); CSO Census 2022 Profile 2 - Housing in Ireland, county-level press releases.
Note: South Dublin, DLR, Meath housing stock figures are from CSO Census 2022 county-level data. Dublin City figure from CSO Census 2022 Dublin City press release.
The per-1,000 normalisation produces a different ordering to the percentage-of-target ranking. Dublin City, which delivered the largest absolute number of new-build units of any single authority (2,344), records only 8.4 per 1,000 housing units - among the lowest rates in the table - because it has by far the largest existing housing stock and a commensurately large target. Conversely, Meath’s strong 168.9% target achievement is also reflected in a high rate of 18.5 per 1,000. The per-1,000 lens and the target-percentage lens together give a more complete picture than either alone.
Part V of the Planning and Development Act 2000 obliges private residential developers to contribute up to 20% of units (or land, or equivalent value) for social and affordable housing. The Part V contribution tracks private development activity: high private-sector output generates more Part V completions; low private-sector output means the mechanism contributes relatively little to social housing supply. Nationally, Part V accounted for 21.9% of new-build social housing delivery in 2022 to 2024 (5,119 of 23,355 units). Authorities with strong private sectors recorded higher Part V shares; those with weak private sectors were more dependent on direct public funding mechanisms.
5. Delivery Mechanism: What Got Built, What Got Bought, and What Got Leased
One of the most significant shifts in Irish social housing delivery over the 2011 to 2026 period is not visible in the headline completion figures: it is the shift in how units were delivered. The mechanism by which a social housing unit reaches the stock - direct LA build, AHB development, Part V obligation, turnkey contract, acquisition, or leasing arrangement - has material consequences for long-term asset value, exchequer cost, maintenance liability, and the local authority’s own capacity as a housing authority.
National social new-build completions by mechanism, 2022-2024
Within the new-build envelope (excluding acquisitions and leasing, which operate under a different accounting framework), the national mechanism breakdown for 2022 to 2024 is as follows:
| Mechanism | Units (2022-2024) | % of New-Build Total |
|---|---|---|
| LA Direct Build | 5,089 | 21.8% |
| LA Turnkey | 3,339 | 14.3% |
| AHB Build | 1,123 | 4.8% |
| AHB Turnkey | 8,685 | 37.2% |
| Part V | 5,119 | 21.9% |
| Total New-Build | 23,355 | 100% |
Source: DHLGH “Overall new-build social housing delivery versus target by Local Authority 2022-2024” XLSX, national totals row.
The dominant new-build mechanism nationally is AHB Turnkey at 37.2%. LA Direct Build accounts for only 21.8% - or 5,089 units over three years across all 31 authorities. Council direct construction is a minority mechanism even within new-build, let alone within total social housing output. This is the practical legacy of the austerity period described in Section 1: direct construction capacity was not rebuilt at the pace needed to meet Housing for All targets through LA-led delivery.
Mechanism variation across authorities
The mechanism mix varies substantially by authority. Authorities with strong AHB relationships (or significant LDA pipeline) tend to show high AHB Turnkey shares. Those with active private development sectors show strong Part V contributions. Those that retained or rebuilt direct construction capacity show higher LA Build shares. No single mechanism profile characterises good performance: the top and bottom of both ranked tables contain authorities with diverse mechanism mixes.
The long-term asset and cost implications of the mechanism mix are material. Finance structures under the Capital Advance Leasing Facility (CALF), Capital Assistance Scheme (CAS), and the Social Housing Construction and Enhancement Programme (SHCEP) each carry different risk profiles, exchequer cost trajectories, and balance sheet treatments. A companion article in this series will examine these finance flows in detail.
Beyond new-build, the full social housing activity data for 2024 shows total national output (new-build plus acquisitions plus leasing plus HAP and RAS) of 20,254 units across all 31 authorities. The relationship between the new-build figures (which count against Housing for All targets) and the total activity figure (which reflects all mechanisms for meeting social housing need) is a frequent source of confusion in Irish housing commentary. Acquisitions, leasing, HAP, and RAS are legitimate tools for meeting housing need in the short term; they do not, however, add to the permanent social housing stock in the same way that new construction does.
6. Total Housing Supply: The Private Completions Context
Social housing delivery does not operate independently of the private housing market. In authorities where private residential output is strong, pressure on the social housing stock is partly relieved by general market supply: households who might otherwise remain on the social housing list can exit through the private market. Where private supply is weak, the social housing system faces both higher absolute demand and a reduced Part V contribution.
The 2025 total completions data - all tenures, from CSO New Dwelling Completions - is relevant context for reading the social housing performance figures in Sections 2 and 3.
Total new dwelling completions, 2025 (all tenures)
In 2025, Ireland completed 36,284 new dwellings nationally - the highest annual total since the CSO series began in 2011, representing a 20.4% increase on 2024. Performance varied substantially across local authority areas. Several major authorities recorded strong total completions growth; others saw declines.
Total new dwelling completions per 1,000 housing units, 2025 (selected authorities)
| Local Authority | 2025 Completions | Housing Stock (2022) | Per 1,000 Units |
|---|---|---|---|
| Cork City | 1,498 | 91,107 | 16.4 |
| Cork County | 2,218 | 149,835 | 14.8 |
| Waterford | 723 | 54,847 | 13.2 |
| Galway County | 1,059 | 82,337 | 12.9 |
| Galway City | 414 | 35,436 | 11.7 |
| Limerick | 869 | 85,363 | 10.2 |
| National | 36,284 | 2,146,519 | 16.9 |
Sources: CSO New Dwelling Completions - annual data by Local Electoral Area (PxStat table NDA05), summed to administrative-authority level; national total from the CSO New Dwelling Completions 2025 release. Housing stock from CSO Census 2022. All authority figures are CSO annual data, not provisional quarterly estimates.
The national apartment share in 2025 was approximately 33% of all completions. Individual authority performance on apartment delivery varies considerably and is a significant indicator of whether cities are building the density required to meet urban housing demand. Authorities where apartments represent a low share of completions face structural constraints on urban housing supply that are not captured in the headline completion count.
The relationship between private supply levels and social housing waiting-list pressure is not deterministic - waiting lists are shaped by population growth, household formation rates, rent levels, and income distribution as well as raw supply. A full demand-side analysis is outside the scope of this article. However, the supply-side baseline is relevant context: an authority that is simultaneously below target on social new-build delivery and below average on total completions per capita faces a compounding rather than partially offsetting dynamic.
7. What Public Data Can and Cannot Tell You
The analysis in sections 1 to 6 draws entirely on published administrative data. That is a deliberate methodological choice, and it is worth being direct about what that choice makes possible and what it forecloses.
What public data makes possible
Published DHLGH, CSO, and Housing Agency data allows for genuine comparative analysis at LA level over a sustained time period. The completion statistics are consistent in definition across all 31 authorities, published to a common schedule, and sufficiently granular - in the DHLGH new-build vs target datasets in particular - to decompose by delivery mechanism. This is a more robust evidence base than is sometimes acknowledged in public commentary on Irish housing.
The ranked delivery comparisons in Sections 2 and 3, the per-unit normalisation in Section 4, and the mechanism breakdown in Section 5 are all achievable from public data with reasonable confidence in the underlying figures. Where there are known data quality issues - inconsistent classification of leasing versus construction completions in some annual returns, changes in the Housing Agency data series, definitional shifts in what counts as a “social housing completion” across DHLGH reporting cycles - these are noted in the methodology section.
What public data cannot tell you
Public completion data tells us what was delivered and broadly by what mechanism. It does not tell us why the gaps between target and delivery exist. Understanding causation requires material that the public record does not contain.
Specifically:
- Site-specific constraints. A delayed or undelivered scheme that appears in the Construction Status Report as “on hold” or “at design stage” for multiple reporting cycles may reflect a planning dispute, a ground conditions issue, a utility infrastructure constraint (water, wastewater capacity, roads), a funding structure problem, or a combination. None of these are visible in the headline figures.
- LA capacity and staffing. The national and per-authority delivery figures say nothing about whether delays reflect organisational capacity constraints - project management resource, specialist procurement capability, housing section staffing levels. The LGMA has published work on LA capacity in this area, but a granular, authority-by-authority staffing and capacity analysis is not publicly available.
- Land availability and cost. What the acquisition figures do not reveal is whether land cost, zoning status, or infrastructure servicing obligations are constraining future pipeline development. Land availability data is fragmentary at LA level.
- Developer and AHB pipeline dynamics. The turnkey and AHB-delivered figures reflect what actually completed. What was planned but never progressed - schemes at pre-planning stage that were abandoned or deferred - is not captured in the public record.
- Demand-side factors. Private completions per capita (Section 6) are a supply metric. They do not capture effective demand or the distributional dimension of who is being housed and who remains on waiting lists.
Why this matters
The public figures are the necessary starting point. They establish the scale of delivery, identify the authorities where the gap between target and output is largest, and point to the delivery mechanisms that have and have not been used.
But “why did [authority X] deliver only Y% of its target?” cannot be read from a DHLGH returns table. It requires fieldwork: interviews with housing section staff, engagement with Approved Housing Bodies active in the area, planning file analysis, infrastructure investment mapping, and financial flow analysis at project level. It requires the kind of mixed-methods independent evaluation that the public record can frame and motivate, but cannot itself provide.
Conclusion
The fifteen-year record of Irish social housing delivery is an interesting and nuanced story. Fourteen of Ireland’s 31 local authorities met or exceeded their 2022 to 2024 new-build targets. In 2025, national new-build delivery reached 90.9% - the strongest performance since Housing for All targets were established - and fourteen authorities again met or exceeded their annual targets.
What the public data establishes with equal confidence is that the variation in delivery across the 31 authorities is substantial and persistent. It is not fully explained by population size, target ambition, or geography. Normalising for housing stock narrows some of the apparent gaps; it does not close them.
Three system-wide findings emerge from the comparative data:
First, council direct construction has collapsed as a delivery mechanism at a national level. LA own-build delivered only 17.9% of its cumulative target across 2022 to 2025 - a pattern that holds across almost every authority and reflects the unreplenished loss of direct construction capacity since the austerity period.
Second, turnkey procurement (LA and AHB combined) now accounts for approximately 51% of all new-build social housing delivery nationally. This is the national delivery model that emerged from capital constraints. Its long-term cost and asset implications should be a question for the next phase of housing policy.
Third, the 2025 data reveals genuine divergence between authorities. In a year when national delivery reached its highest recorded rate, roughly one third of authorities still delivered below 70% of their targets. The spread between delivery in 2025 is wider than in any of the preceding three years. This divergence deserves closer analysis than headline national figures allow. It would be interesting to carry out an exercise to investigate any correlation with infrastructure and social place investments.
Data Download
The datasets underpinning the ranked tables in this article are available for download:
- la_housing_delivery_2025.csv - All 31 local authorities: new-build social housing target, delivery, and percentage of target, 2025, ranked. Source: DHLGH.
- la_housing_delivery_2022_2024.csv - All 31 local authorities: cumulative new-build social housing target, delivery, and percentage of target, 2022-2024, ranked. Source: DHLGH.
- cso_total_completions_by_authority_2022_2025.csv - All 31 local authorities: total new dwelling completions (all tenures) 2022-2025, with year-on-year change. Source: CSO New Dwelling Completions (PxStat NDA05).
These datasets are derived directly from DHLGH and CSO official publications and are provided as a convenience for researchers, journalists, and policymakers. Blue Dot Consulting makes no warranty as to their completeness beyond the source data; users should refer to the primary DHLGH and CSO publications for definitive figures.
Methodology and Sources
This article draws on the following publicly available data sources.
Primary data sources:
- DHLGH “Overall new-build social housing delivery versus target by Local Authority 2022-2024” (Excel file, July 2025), published at gov.ie. Provides the definitive per-LA new-build delivery and target figures for 2022, 2023, 2024, and the cumulative 2022-2024 period, decomposed by mechanism (LA Build, LA Turnkey, AHB Build, AHB Turnkey, Part V).
- DHLGH “Local Authority New-build Delivery VS Overall Social Housing New-build Targets 2025” (Excel file), published at gov.ie. Provides the 2025 single-year per-LA data used in Section 3.
- DHLGH “Own-build social housing delivery versus target by Local Authority” (Excel file), providing the LA direct construction sub-series for 2022-2025 used in Section 2.
- DHLGH Social Housing Activity by Local Authority, annual files for 2022, 2023, 2024, and 2025, published at gov.ie. Provides full social housing output data (new-build, acquisitions, leasing, RAS, HAP) used in Section 5.
- DHLGH Social Housing Delivery Output Q4 2018 (CSV dataset), published at opendata.housing.gov.ie. Primary source for 2018 national mechanism data.
- CSO New Dwelling Completions (quarterly releases, Q1-Q4 2025), published at cso.ie. Total completions (all tenures) data used in Section 6.
- CSO Census 2022 Profile 2 - Housing in Ireland, county-level press releases (published July 2023). Housing stock figures used as the denominator in per-1,000 normalised comparisons.
- Housing Agency, Summary of Social Housing Assessments (SSHA) 2024, published April 2025, housingagency.ie.
Methodological notes:
- The “new-build social housing delivery” definition follows the DHLGH Housing for All target framework: LA Direct Build + LA Turnkey + AHB Build + AHB Turnkey + Part V. Acquisitions, leasing (SHCEP, enhanced long-term leasing), RAS, and HAP are excluded from this definition. Where the article refers to “total social housing output,” it uses the broader DHLGH activity file definition.
- Per-1,000 normalisation uses total housing stock (Census 2022) as the denominator, including all dwellings (occupied, vacant, holiday homes). Using occupied households only would produce slightly higher rates but would not materially change relative performance. Total housing stock is used consistently throughout for comparability.
- 2025 completions figures for all authorities are CSO annual data by Local Electoral Area (PxStat table NDA05), summed to administrative-authority level (LEAs tile the full county, so the totals include one-off rural completions). On this basis Limerick completed 869 dwellings in 2025 and 1,006 in 2024 - a year-on-year decline of 13.6%. CSO data is used in preference to local-source estimates throughout.
- DHLGH reporting categories for delivery mechanisms evolved between 2018 and 2025. The 2018 data uses Rebuilding Ireland framework categories; the 2022-2025 data uses Housing for All framework categories. Where the article compares across periods, it identifies the relevant dataset and definition.
- The full quantitative data supporting this article, including the parsed DHLGH XLSX files, was prepared from official DHLGH data downloaded from gov.ie by the Blue Dot Consulting research team. Raw data and workings are retained in accordance with BDC’s research transparency standard and are available on request.
About Blue Dot Consulting
Blue Dot Consulting is an independent consultancy specialising in technology, project management, research & advisory services enabling sustainable infrastructure delivery.
The article was produced without commercial sponsorship or affiliation with any local authority, developer, or housing body.
To receive future research publications from Blue Dot Consulting, contact us through bluedotconsulting.ie.